One of the questions that FPGA designers wonder and sometimes even argue about, is: Should the implementation tools focus on Worst Slack (WS) or Total Negative Slack (TNS)?
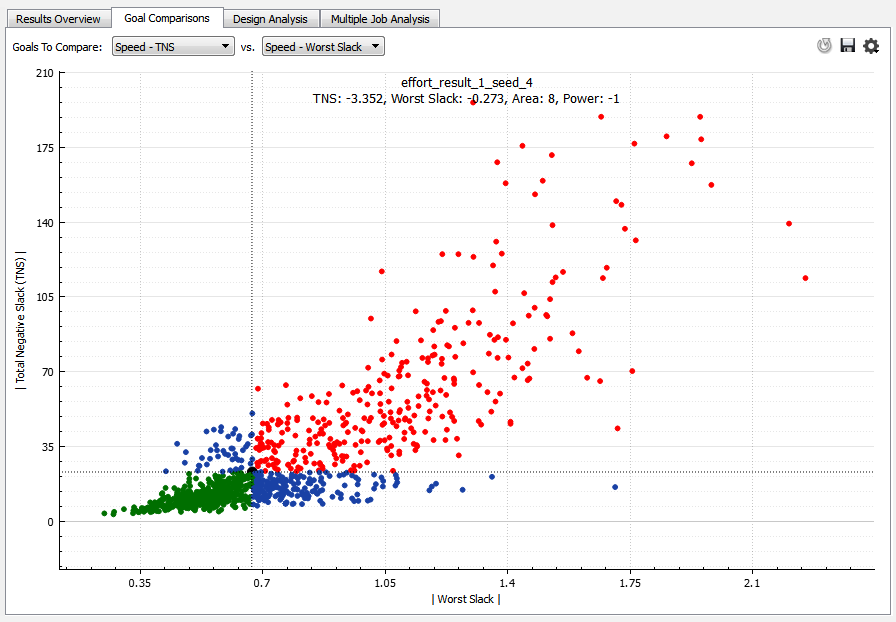
To answer this question, we added a feature to collate the data for both timing values and ran about 1000 compilations on a small design (Cyclone V, about 9% utilization) using different synthesis and fitter settings.
This is what we see. The default result is marked by the black dot. The Y-axis represents the absolute value of the TNS and the X-axis, the absolute value of failing WS.
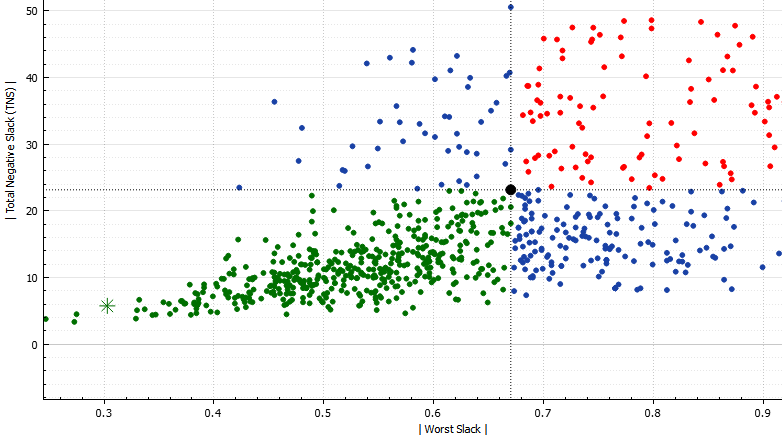
The chart is divided into 4 quadrants, green means these compilations give better TNS and WS compared to the original design.
Besides looking like a pretty smattering of colored dots, we can see that the TNS flattens out when it is closer to zero but the worst slack still keeps improving.
Taking a closer look,
What do you think?
Make your own conclusions, and please share your thoughts with us!


I've always argued that TNS metric is useless for a designer who wants to fix a specific timing problem, and the above TNS-WS scatterplot confirms that claim. If there is a critical path with relatively small WS, something like 300-400ps, place & route tool spends a lot of time optimizing that path, and all other paths of the design. As the WS grows, place & route tool gives up earlier, and leaves lots of other routes unoptimized. So you'd see larger variance of TNS as WS grows. Another example is poor placement of RAM with wide data. Let's say that RAM datawidth is 256bit, and the timing from nearest register to the RAM misses timing by 0 to 200ps depending on the data bit and tool options, Multiply it by 256, and you get a cloud of TNS variations between 0 and 51.2K, whereas WS will always report 0 to 200ps.
Thanks,
February 11, 2015 at 7:05 pmEvgeni
It is nice to have data that proves what you believe. We will be running more tests across various devices and designs. Another dimension that we want to add in is the number of paths that adds up to the TNS. Hopefully we can gain more insights from the data.
February 13, 2015 at 2:36 am