
During InTime development, we got curious about the commonly-held premise that Area and Speed (and correspondingly, timing score) have an inverse relationship. Meaning that if you want more speed, you'd need to sacrifice area and vice versa.
So we did tests on many designs to verify this relationship. Basically to obtain the results, we built those designs with different combinations of synthesis and place/route settings, without any change to the source code.
Then we plotted Timing Score (ns) versus Utilization (%).
Definitions:
Timing Score:
- Sum of Total Negative Slack values throughout the design.
- Ideal value is 0 which implies no timing errors (able to achieve Speed target).
- Referred to as "Speed" in the graphs.
Utilization
- Percentage of logic used.
- Ideal value is as low as possible.
- Referred to as "Area" in the graphs.
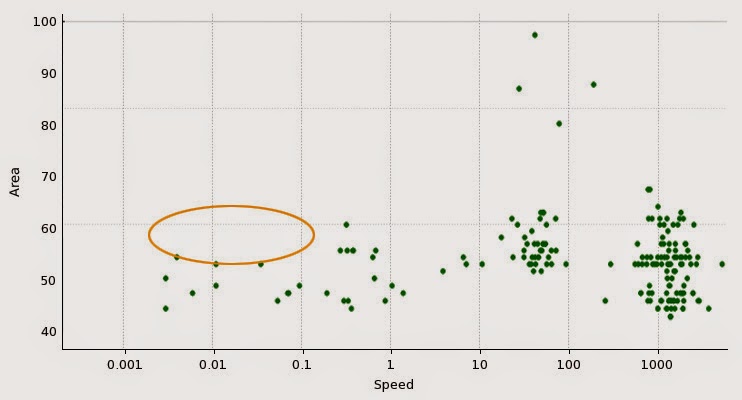
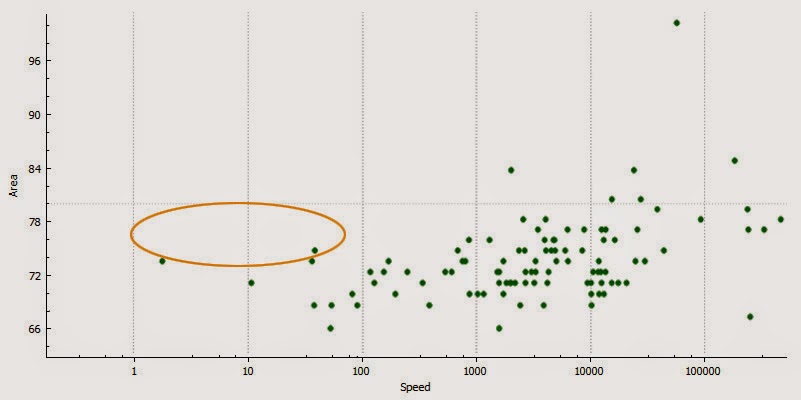
Two representative examples that we shall call A and B are shown below.
Design A has 50% device utilization and Design B, 70%. We used InTime to test 1000 different groups of tool settings, varying between optimizing for area, speed or both.
Here's a snapshot of what we found. Note that the scale of the "Speed" axis is logarithmic.


Just by eyeballing the above, you can probably tell that if you plot a trend line, it will curve upwards towards the right.
More importantly, these plots suggest that higher area doesn't necessary equate to faster speed. This is shown by the absence of significant data in the circled portions below.
For Design A, if you ignore the four outliers on the upper right, the majority of the builds achieve Area within a 45% - 65% range and when Timing Scores are around 1000. However, the lack of any Area results above 55% when Timing Scores are good (closer to 0) is telling.
Same applies to Design B as well--majority of results clustered around Area (66% - 84%) and Speed (1000 - 10000), and no Area results above 70% when Speed was close to 0.
In the circled portions, there should be a lot more results if the premise that using more area can achieved faster speed. Moreover, we observed that for bad timing scores, area tended to be worse. (Or perhaps it is the other way round--the larger the area, the worse timing score becomes)
Do you agree? Let us know your thoughts and experiences.