Oh! The paint hasn't dried on my Vivado 2016.1 blogpost and 2016.2 is already out!
The early months of 2016 saw the release of Vivado 2016.1. We naturally assumed that it would be better than the previous version, given what we heard from beta users and developers.
In many cases, users usually base their opinions on results from a single design; for example, Vivado 2015.x gives you N ns of Total Negative Slack (TNS) or Worst Slack (WS). If Vivado 2016.1 gives you a better result, the newer version performs better, otherwise it is worse. This is about the average amount of patience a typical user can muster to form an opinion, since the overriding concerns are more about finishing projects rather than evaluating the tools.
Well, at Plunify, we did something like a mythbuster (as portrayed in the popular TV series) -- we started with the question of "whether 2016.1 is better than 2015.4".
Our plan: Use the InTime software to run 100 compilations of a design with different sets of synthesis and place-and-route parameters generated by InTime, first on 2015.4 and then on 2016.1. The parameters and design sources are kept the same in both experiments.
- If there are better results overall in 2016.1, then this myth is confirmed;
- If they are slightly better or if only certain timing aspects are better, it is considered plausible;
- Lastly if results are worse in general in 2016.1, then the myth is deemed busted.
And the conclusion is
(Disclaimer: we tested only 1 design. See details below)
Tests Design
Test Summary and Results
| 2015.4 | 2016.1 | |
| TNS | 325.4ns | 324.67ns |
| WS | 0.462ns | 0.456ns |
Total number of compilations: 100
75.95% of the TNS results are better in 2016.1
63.29% of the WS results are better in 2016.1
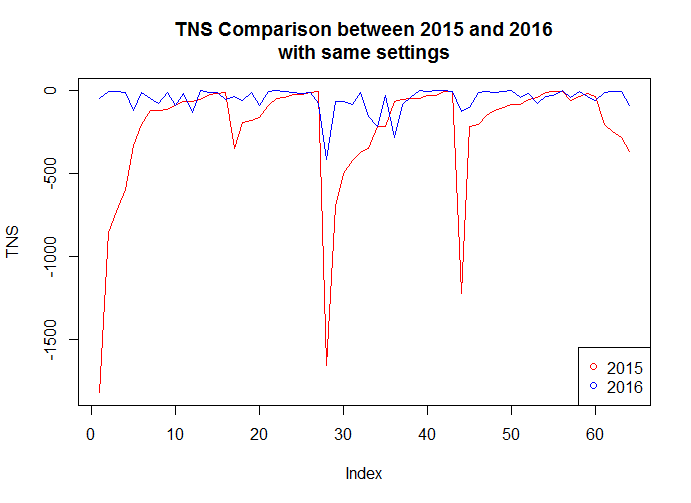
Here's a chart showing the difference. It is plain that 2016.1 ("2016") produces better timing results than 2015.4 ("2015").
The interesting takeaway is that while the original result with default synthesis and place-and-route settings improved slightly in 2016.1, using settings intelligently provided big improvements. All the more reason to use InTime!
Questions?
If you have any questions, feel free to contact us. We can even do more tests on request if you'd like to contribute test designs.
Now on to 2016.2...


Great post with interesting results – it aligns with the statement from the 2016.1 press release from Xilinx:
"As a result, both UltraScale and UltraScale+ device portfolios now deliver an additional 20-30% performance at high utilization." [1]
Will be interesting to see what the improvements on SSI devices are for this release, as well as Ultrascale+.
[1] http://www.streetinsider.com/Press+Releases/Xilinx+Extends+SmartConnect+Technology+to+Deliver+20+–+30%25+Breakthrough+in+Performance+for+16nm+UltraScale%2B+Devices/11515996.html
June 15, 2016 at 6:11 am"Index" axis doesn't carry much information to a typical user. Perhaps you can sort the results by TNS, so that charts are increasing. Then you can compare AUC (Area Under Curve) of the two, similar to how it's done in ROC curves.
June 16, 2016 at 3:09 am