Recently we had an opportunity to optimize an FFT design generated from the Intel DSP Builder tool (in conjunction with MatLab and Simulink).
This is an interesting project because the designer did not develop the RTL but generated the RTL from DSP Builder. Therefore a lot of the performance depends on how good the generated RTL is. The target device is a Stratix 10 one - a high-end FPGA that has been in the market for some time now. Here is an outline of how DSP Builder works with other Intel FPGA tools.

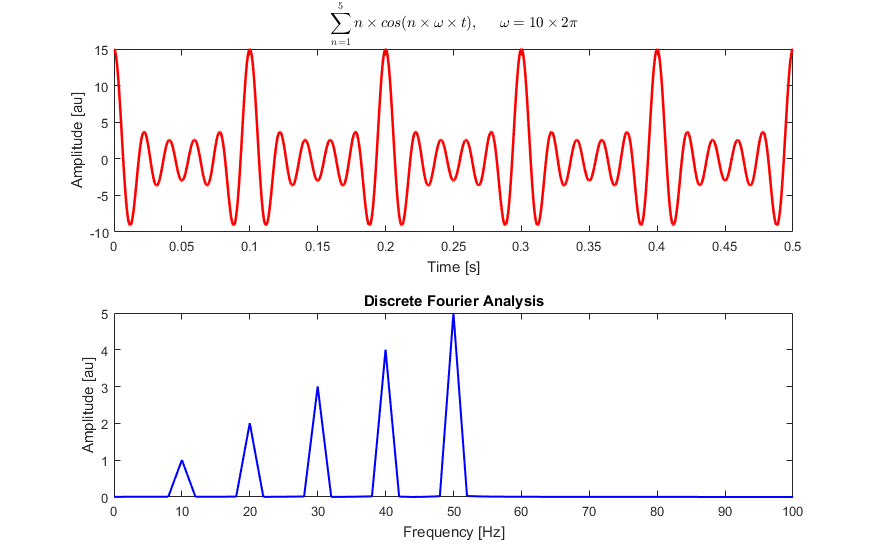
Credits: Intel DSP Builder https://www.intel.sg/content/www/xa/en/software/programmable/quartus-prime/dsp-builder.html
We are always measuring how well design exploration performs for newer device families and tools. One of InTime's key value propositions is that you can avoid changing the RTL but get better results. Our goal is to see that InTime performs well for RTL generated in this manner.
Design Specifications
Some basic information:
Name: "FFT"
This is, of course, Fast Fourier Transform - a common IP block or function implemented on FPGA using DSPs.
FMax: 650MHz originally, now over-constrained to 800MHz
At 650MHz, the design has no timing issues. Feeling aggressive, we edited the SDC file to increase the target clock frequency to 800MHz.
This resulted in a 246ps Worst Setup Slack failure.
FPGA Device: Stratix 10 1SG280LN3F43E1VG
Logic Utilization: 21%
Below is the utilization summary.

Total Negative Slack (TNS): -183.89ns
Worst Setup Slack Slack (WNS): -0.246ns
FPGA Tool Version: Quartus Prime Pro Edition 19.1
Interpreting the results
One of the things we understand about design exploration is that there is a certain level of noise and randomization present in many of the algorithms used. Hence, although the best result is what we want, it is important to measure how "good" the whole exploration is. "Good" can be defined based on a series of different statistics.
However, to keep this simple, we use only the criteria below.
- Median TNS and WNS (50th percentile)
- Average TNS and WNS
- Average for results >-500ns (for TNS) / Average for results >-0.5ns (for WNS)
- Best TNS and WNS
- Worst TNS and WNS
- % improvement over original TNS / % improvement over original WNS
- Std Deviation of TNS and WNS
Step 1: Vary Placement Seeds
Placement Seeds are the linchpins of design exploration for many Quartus users. The first step we did was to run 100 seeds.
The following histogram shows the TNS results in nanoseconds. The best result is in the -100ns to -80ns bin.
We cut off the "underflow" bin at -500ns as that tail is very long and we are only interested in better TNS results.

What is interesting here is that we expected more of a normal distribution with a single peak, rather than 2 peaks here. Note that the original TNS was -183ns, and that is already closer to the peaks with better results.
Step 2: Run InTime
A Placement Seed is typically regarded as a placement setting. Our InTime design optimization tool uses a bigger mix of synthesis and placement/route settings. (Click here for more information about InTime). Similarly, we ran 100 builds on InTime and the results are superimposed below on the previous Seeds chart.
 You can tell from the chart that the best result is better than the best Seed result. However, it is not conclusive in the sense that this best result may be an outlier and rarely-seen.
Additionally, you can see that the peaks overlap in the -140ns to -100ns bins.
How about the WNS?

Based on the charts, Seed results have a single peak with a high number of occurrences in the "better" bins. InTime's results, however, are more spread-out (greater deviation and more bad results) but have the best result.
Which is better? It is too premature to call it either way, because one of InTime's key features is that it requires training data to make better predictions.
Earlier rounds can improve results of subsequent rounds. So we decided to run a 3rd step to establish if InTime will improve with more data.
Step 3: Run InTime Again (Round 2)
We ran another 100 builds on InTime. (This takes into account "Round 1" results as training data).
The results are shown below in green and superimposed on those from the earlier rounds.
The first chart is for TNS and InTime now looks even better.

Similarly for WNS...

Now, this is visually more conclusive and obvious that the distribution of the green columns is better than that of the Seeds columns.
The best result for InTime (Round 2) is a few orders of magnitude better than the Seed ones.
Comparison
We talked about statistics that evaluate design exploration.
Here are the numbers as seen in InTime. (Note: The number of data points may be slightly more or less than 100 due to build failures or crashes)


A few observations:
Firstly, the standard deviations of WNS and TNS of Seed runs are lower than those of InTime runs.
The TNS and WNS averages are better for Seeds. We interpret this as the impact of Seeds being directly related to the starting TNS/WNS values.
You cannot get a dramatic improvement with Seeds since their results don't deviate too much.
Some users run 1000 seeds (before using InTime) to get just one passing result. With InTime, they can probably run a lot less and get better quality of results.
Secondly, a combination of settings and Seeds (Round 2) improved FMax by 8.48% over the original FMax - 3x better than just using Seeds.
If you look at the median or "Average > 0.5ns" numbers, you will see that the peak shifts to the right (better) for InTime R2. This suggests that the combined exploration produces better results.
What's Next?
One reviewer commented that we should run another 100 seeds since we ran a total of 200 points for InTime and only 100 datapoints for seeds. We are currently doing that now and will update this article when done.
So here is the data. We colour the results of the 2nd 100 seeds purple and made it slightly transparent so you can see how it overlaps.

TNS Histogram - Seed 1 (Orange) versus Seed 2 (Purple)

WNS Histogram - Seed 1 (Orange) versus Seed 2 (Purple)
Conclusion
Based on the results of InTime Rounds 1 and 2, InTime is able to improve the quality of results with relevant training data.
Relating this to the goal of understanding whether RTL generated via tools such as DSP builder/Mathworks can be optimized, this exercise shows that with proper training data, InTime improves the quality of results without changing a single line of RTL.
For more information, please refer to http://www.plunify.com/en/intime/
To get an evaluation copy, contact us at tellus@plunify.com